Net worth tracking
I like to keep a close track on my spending and income and to optimize both using historical data. I used to have a large spreadsheet for this purpose, but I was lucky to find the excellent HomeBank instead of keeping it. Unfortunately, HomeBank alone eventually wasn’t enough to track all my assets.
I have a custom setup which collects the values of my assets. Most of the code is at github.com/MichalPokorny/scripts (with horrible undocumented dependencies on btckit, worthy and maybe a few others). In this post, I give a high-level overview of how it works at the moment.
The problem
The system needs to keep track of various assets which aren’t straightforward to appraise:
- I own a few Bitcoins (which were a large portion of my wealth back in the last bubble at the end of 2014).
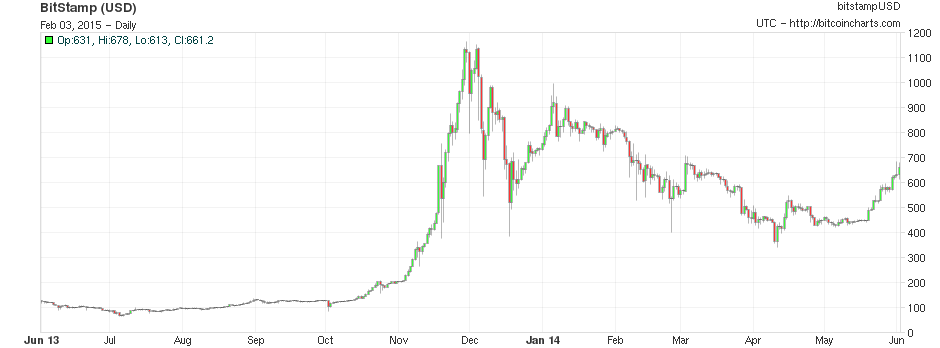
Bitcoin price 06/2014-06/2015 - the largest Bitcoin bubble yet. The price since dropped down to today’s ~$250. Image from bitcoincharts.com.
I have some money in conservative investment funds backed mostly by government bonds.
As I am writing this, I have a separate French bank account in euros. At the time when I needed to track it, HomeBank did have a limited form of multicurrency support, but if I remember correctly, I had a good reason for not using that (the feature may not have been usable in my particular case).
In 2014, I started dabbling in stocks.
And I also have some cash.
The original problem was keeping track of my fiat money and of my Bitcoins. I wanted to have something stupidly hacky and working. Net worth tracking may have better solutions today (even for the weird structure of my assets), but I guess I’m going to keep using this solution until I’m bored enough to find a replacement :)
Collecting and storing the data
I have a Ruby script that figures the value of my assets using various sources
and then saves the data. The script is in ~prvak/bin/net-worth-keeper
and it’s run as a cronjob every hour or so:
# crontab
SHELL=/bin/bash
PATH=/bin:/usr/bin:/usr/local/bin:/home/prvak/bin:/home/prvak/.gem/ruby/2.0.0/bin:/home/prvak/bin/gobin
HOME=/home/prvak
0 */1 * * * net-worth-keeper --log --quiet
Cron has the added benefit of sending me a mail when the script fails.
I keep all the data in a simple CSV file at ~prvak/misc/net-worth.csv.
CSVs are simple and readable by everything (think OpenOffice Calc, Gnuplot, Ruby, Octave, etc.).
They are also human-readable and writeable.
The beginning of the CSV file looks like this (data obviously scrambled):
2013-09-28 21:00:05,1380394805,11013579.15,123456.7,890123.45,9999999,0.0,0.0
2013-09-28 21:16:15,1380395775,11015200.366,125000.7,890200.666,9999999,0.0,0.0
...- The first column (
2013-09-28 21:00:05) is the date and time the data was collected, in a human-readable format. - The second column (
1380394805) is also the date and time, but in machine-readable format (Unix time = number of seconds since the Epoch). - Every remaining field contains the value of an asset in CZK (Czech koruna).
Note the zeroes at the end - for example, I didn’t have any stocks at first. When I needed to start tracking them, I just wrote the tracking code and ran a complicated NoSQL CSV migration (i.e. I added “,0.0” at the end of each line).
New entries are always appended at the end of the file.
The sources of asset values
The original net-worth-keeper just fired a bunch of other programs using
the parallel gem. Every program’s responsibility was to get the price of
one asset (e.g. my Bitcoins) and output it in CZK. net-worth-keeper waited
until those programs crashed or gave a valid output, parsed the output and
appended it to the CSV file.
Those binaries shared a lot of common code or common libraries (like currency
conversion) and they fired a lot of expensive Ruby interpreters.
I eventually moved shared code into one directory.
Now net-worth-keeper calls a library function
(Prvak::Finance::NetWorth.load_assets), which returns a breakdown of asset
values as a Ruby Hash (like {'Money' => 12345, ...}).
The breakdown is still done in parallel, but now most of the “workers” are actually
just Ruby functions (like Prvak::Finance::IKSPortfolio.load.value or
Prvak::Finance::Homebank::Accounting.load.total_value). I can still use
separate executables where needed. Every data source just returns a single
number (of CZK) or crashes and burns.
I have the following data sources:
Prvak::Finance::Homebank::Accountingloads a static HomeBank .xhb file, which has a simple XML format. It uses the wonderfulnokogirigem to parse it and crudely adds up all transactions. There are a few small gotchas regarding “hidden accounts”, internal transfers, and so on.Prvak::Finance::IKSPortfoliounderstands investment funds provided by the company I invest through (IKS). Basically, you buy a number of “investment certificates” for price X and hope price eventually befomes >X. I have “investment certificates” for several funds (they differ in their asset allocation).I store the relevant data in
~prvak/.iks-portfolio.yml:--- invested: 9900000 assets: KB Konzervativní profil: 500317 Amundi Funds Equity Global Resources (CZK): 23144 ...investedstores the amount of CZK invested into investment funds. Theassetshash is keyed by the name of a fund and values are numbers of investment certificates you hold. I then use a small gem of mine (iks-scrape) to get the value of those.iks_scrapecan’t use any API to get the price, but luckily there is a constant URL (http://www.iks-kb.cz/web/fondy_denni_hodnoty.html) where you can find the data. The incredibly usefulmechanizegem parses the HTML like a piece of cake.I use
BtcKit::BtcPriceto get the pitiful state of my Bitcoin hoard. There’s again a file in my home which stores how many BTC do I have. I simply pull some recent CZK trades from the LocalBitcoins JSON API and compute an average. I tried various other providers for the data with varying success. LocalBitcoins is good enough for now.Stocks used to be handled by
Prvak::Finance::Stocks. This is now a thin wrapper around worthy (the Ruby implementation broke one day and I decided I want to learn a bit of Go instead :).Worthy loads a JSON file from my
~that describes what stocks and foreign currencies do I own on my broker account:{"stocks": {"MSFT": 123, "AAPL": 456, ...}, "currencies": {"USD": 666, ...}}The yahoo_stock_api module sends one batch request to the Yahoo finance API. The request format could use some readability improvements and it would be cool if the API decided on one error value instead of randomly using
N/A,1.0or0.0, but if you use just the basic stuff, it’s solid.I only ask for the last closing price and for the tickers (to ensure the order of stocks is in sync).
After we know how much money is the broker account worth, we just need to convert the various currencies to CZK and we are done. I use the very useful freecurrencyconverterapi.com - the API is dead simple and does everything I need. This Go module calls what I need.
Finally, there’s the euro account. It’s again stored in a file, and I convert to CZK again using freecurrencyconverterapi.com.
Using the data
The net-worth-keeper binary by default runs in an “interactive mode”,
which asks the the terminal-table gem to print a summary of asset values
(remember, I track each asset separately, not just the sum of everything).
In addition to this, I also have a small
Gnuplot file in ~prvak/misc/plot-net-worth.gnuplot, which plots
a stacked plot of asset values:
set datafile separator ','
set xdata time
set format x "%d.%m"
set timefmt "%Y-%m-%d %H:%M:%S"
set key vert out center left
set autoscale xfixmin

plot \
     "net-worth.csv" u 1:($6+$5+$4+$7+$8) w filledcurves x1 title 'EUR účet', \
     "" u 1:($6+$5+$4+$7) w filledcurves x1 title 'Akcie', \
     "" u 1:($6+$5+$4) w filledcurves x1 title 'KB účty', \
     "" u 1:($6+$5) w filledcurves x1 title 'IKS fondy', \
     "" u 1:6 w filledcurves x1 title 'Bitcoiny', \
     \
     "" u 1:6 w lines title 'Bitcoiny', \
     "" u 1:5 w lines title 'IKS fondy', \
     "" u 1:4 w lines title 'KB účty', \
     "" u 1:7 w lines title 'Akcie', \
     "" u 1:8 w lines title 'EUR účet', \
I run it using in an interactive Gnuplot session. Sorry for not including the output - I’m not comfortable with giving it to everyone on the internet. If you squint just right, you can actually see some trends where they should be :)
Final notes
I have recently started rewriting parts of the code to Go. There are many things
I like about Go - like the syntax, the blazing speed of tools, the One True
Formatting (gofmt), or the package management (imports + go get).
On the other hand, it is much less annoying to write quick JSON/YAML parsers
in Ruby than in Go, but I hope this is just a temporary rough edge.
The language is also less mature, so some libraries don’t quite exist yet
(like Mechanize).
However, I have high hopes for Go.
It would be nice to extend this system one day to track my “savings ratio”. The “savings ratio” is exactly what it says on the tin - how much money you save divided by how much money you earn (not including investment income). I hope to write one day about why I think tracking this value would be useful.
This system has problems when I’m moving larger amounts of money through “asset boundaries” - for example, it takes some time for money to travel between bank accounts. One needs to remember to put the transaction in both places once it finishes. A similar problem arises when I expect to be reimbursed for an expense by an employer - I don’t want to record that as a wedge in my nice graphs, but I also don’t want to have large disagreements between my records and the real state of my accounts. I don’t think I can have both.